Trend
Real-Time Trend Visualization
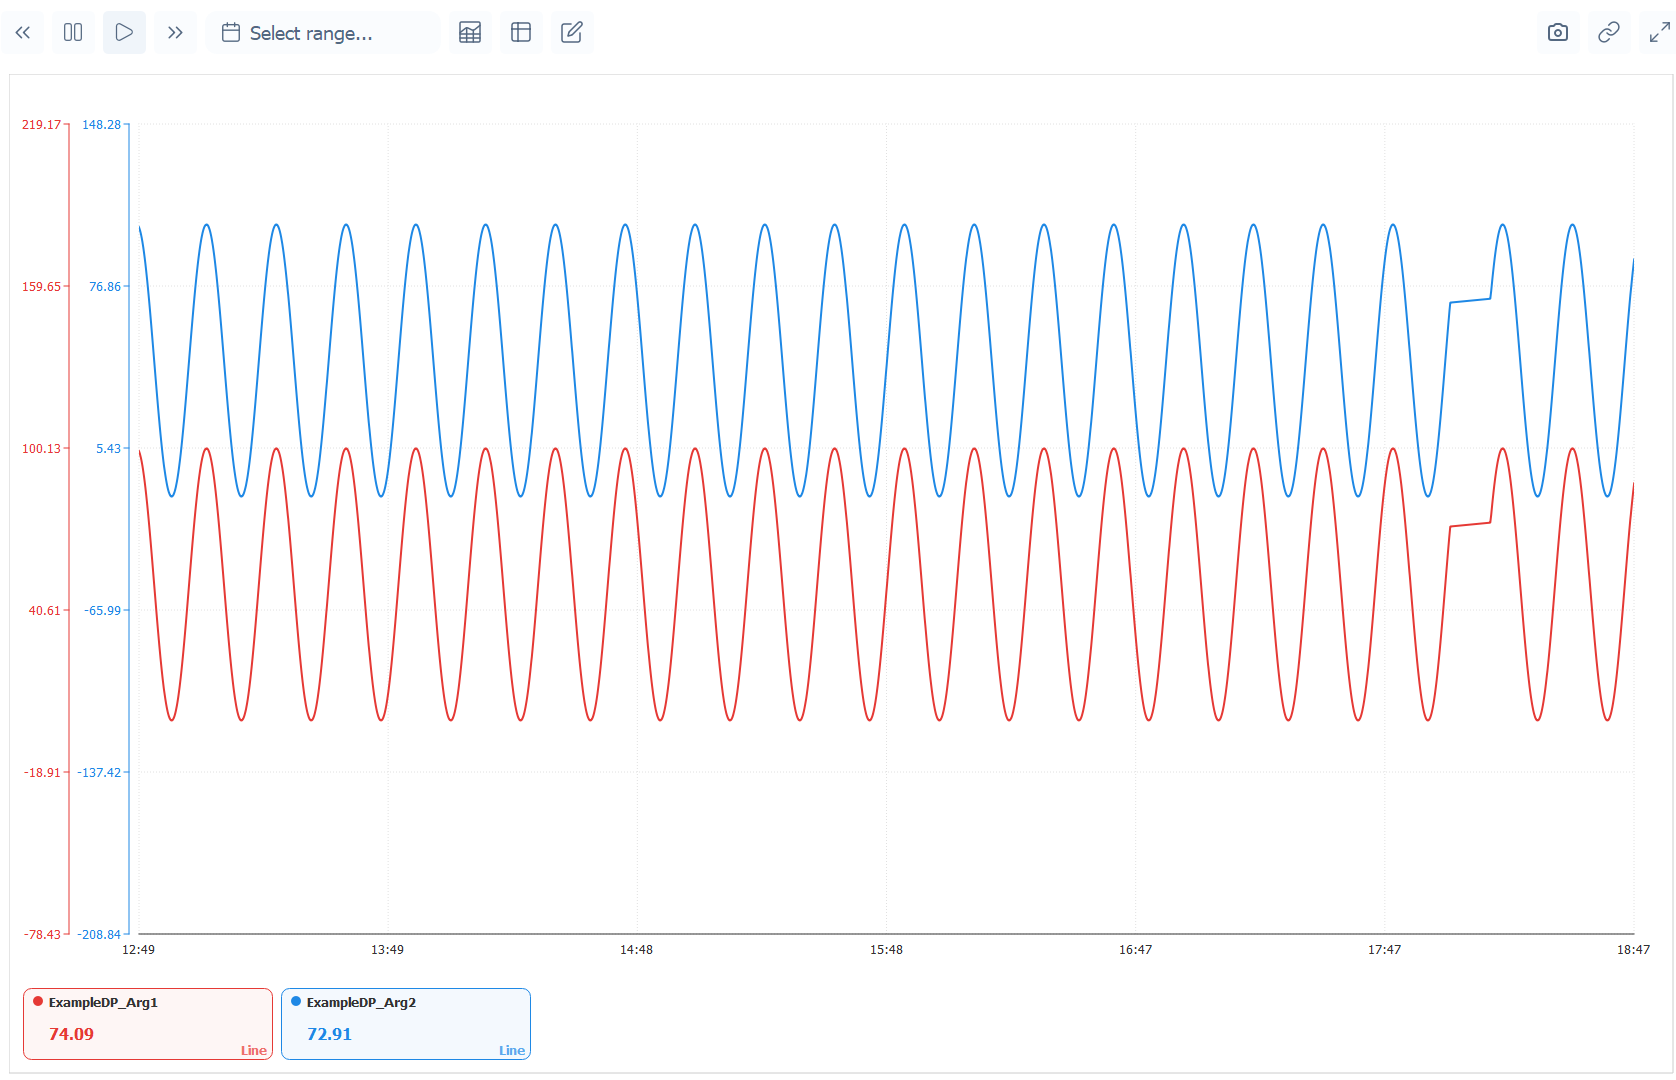
The Trend EWO is a full-featured chart widget for real-time and historical data visualization. It supports multiple curves with independent Y-axes, crosshair inspection, zoom/pan, statistical analysis, and a tabular data view — all rendered in a custom-painted C++ component optimized for continuous data streams.
Key Features
Multi-Curve Display
Multiple trends plotted simultaneously with independent colors, line widths, and visibility toggles. Curves can share a Y-axis or be grouped by unit.
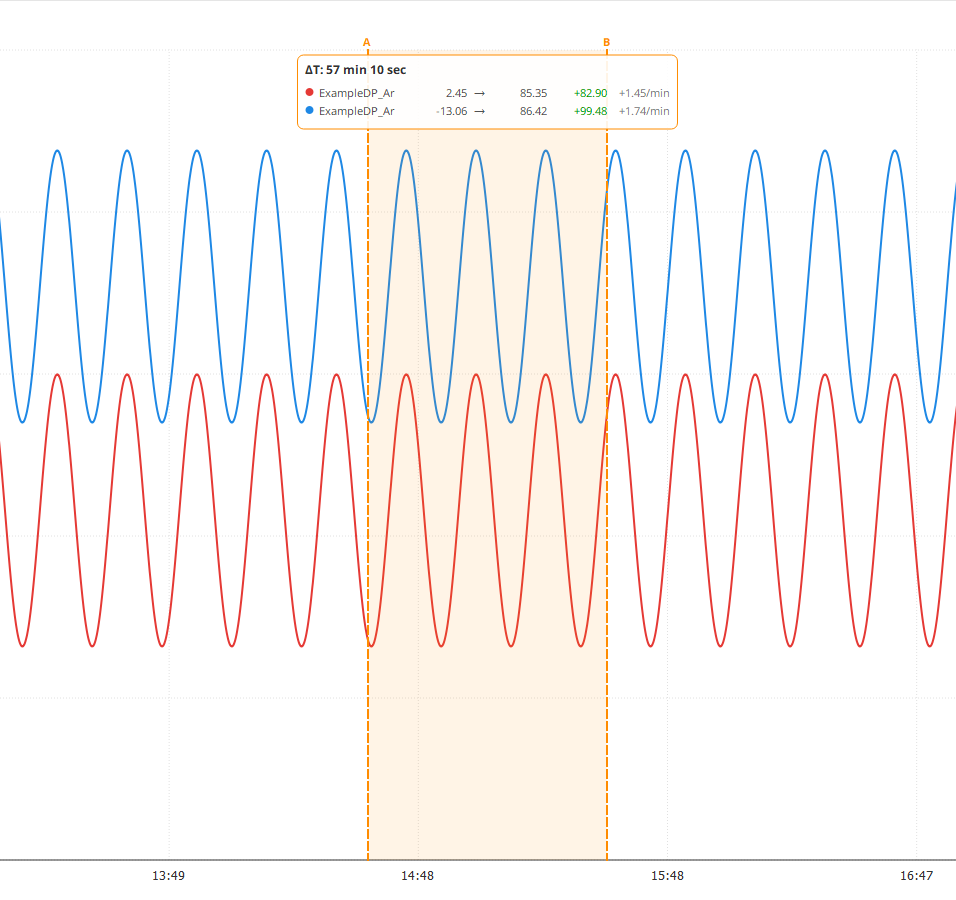
Interactive Crosshair
Hover to inspect exact values at any timestamp — a vertical crosshair follows the mouse with tooltips showing per-curve values.
Statistical Analysis Panel
A collapsible statistics panel shows MIN, MAX, AVG, and other aggregations for the visible time range:
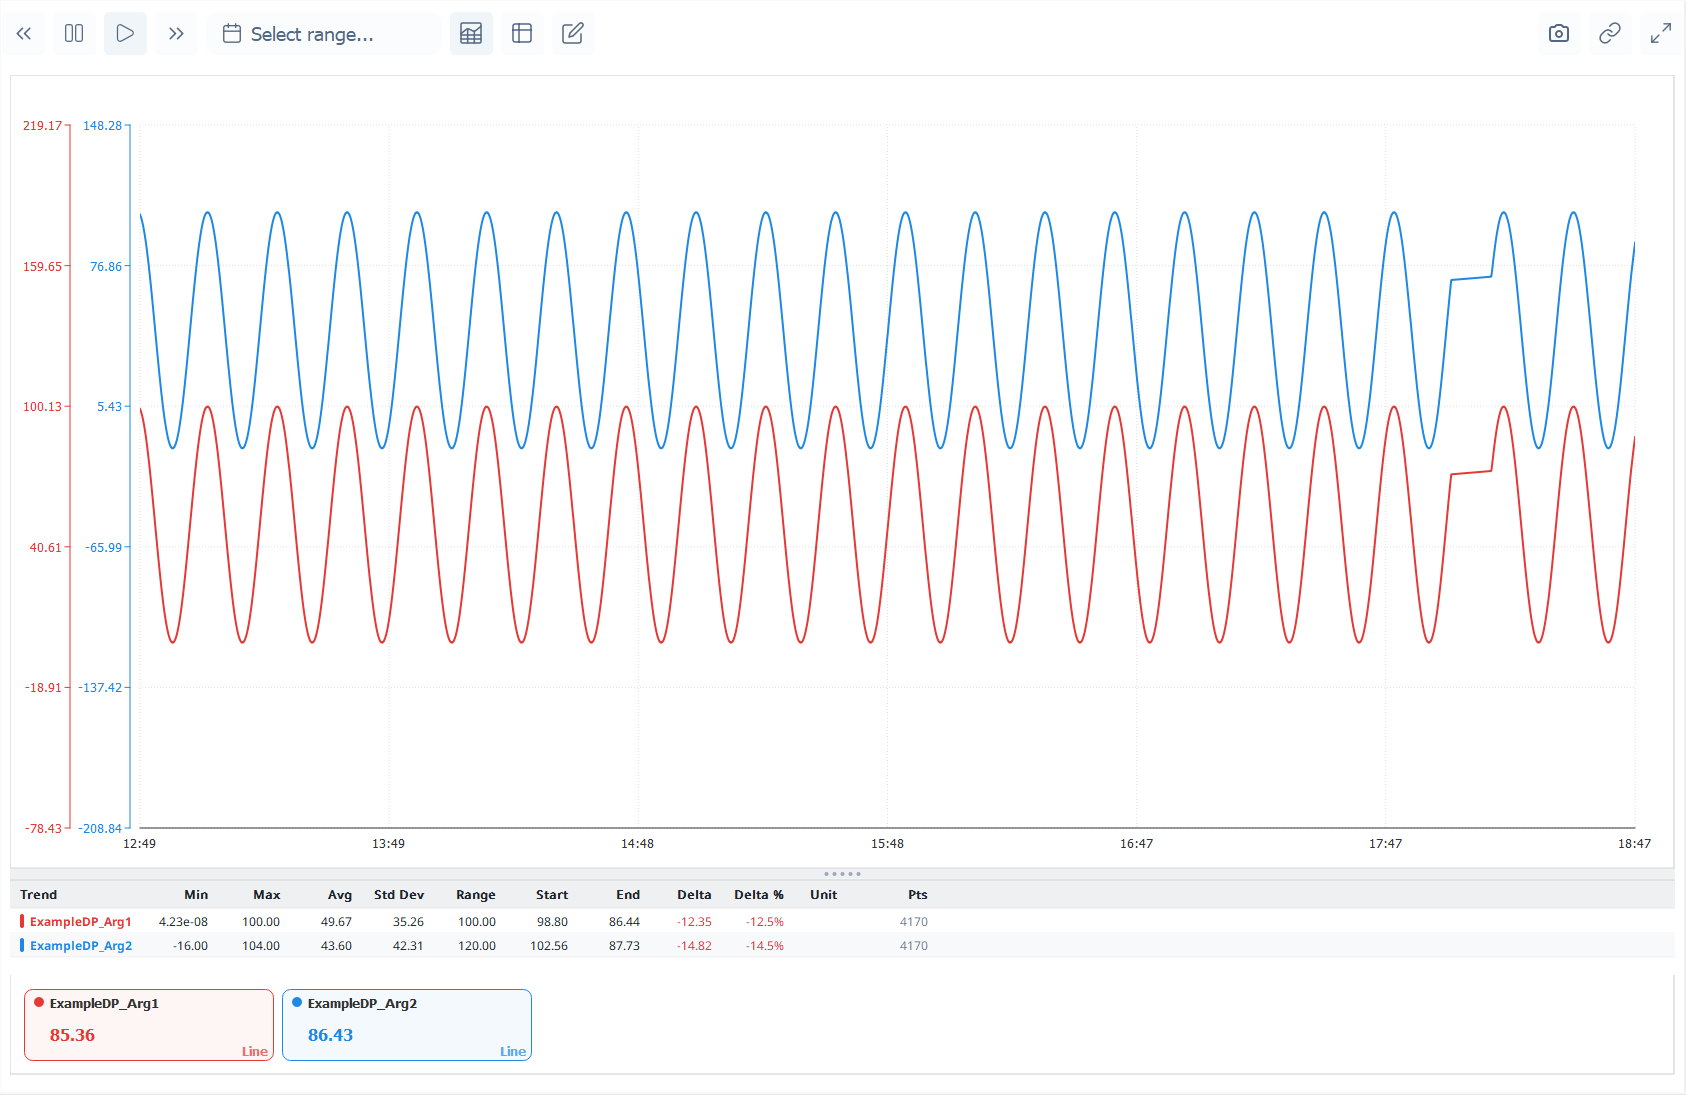
Trend Analysis
Tabular Data View
Switch between chart and table view to inspect raw data values:

Auto-Scroll Mode
Real-time mode with a configurable time window that automatically scrolls to keep the latest data visible.
Zoom & Pan
Mouse wheel zoom on both axes, click-drag to pan, and double-click to reset view. Zoom can be restricted to X-axis only for time-based analysis.
Main Properties
| Property | Type | Description |
|---|---|---|
Color_Background |
QVariant |
Chart background color |
Color_Grid |
QVariant |
Grid line color |
Color_Axis |
QVariant |
Axis line and label color |
Color_Text |
QVariant |
General text color |
Color_Crosshair |
QVariant |
Crosshair line color |
Color_TooltipBackground |
QVariant |
Tooltip background |
Grid_Visible |
bool |
Show grid lines |
Grid_HorizontalLines |
int |
Number of horizontal grid lines |
Grid_VerticalLines |
int |
Number of vertical grid lines |
Axis_AutoScale |
bool |
Auto-fit Y-axis to data range |
Axis_YMin |
double |
Fixed Y-axis minimum |
Axis_YMax |
double |
Fixed Y-axis maximum |
UI_CrosshairEnabled |
bool |
Enable crosshair inspection |
UI_ZoomEnabled |
bool |
Enable mouse wheel zoom |
UI_PanEnabled |
bool |
Enable click-drag panning |
Line_DefaultWidth |
int |
Default curve line width |
Line_ShowPoints |
bool |
Show data point markers |
AutoScroll_Enabled |
bool |
Real-time auto-scroll mode |
AutoScroll_WindowSeconds |
int |
Visible time window (seconds) |
Statistics_Visible |
bool |
Show statistics panel |
Statistics_Height |
int |
Statistics panel height |
Table_Visible |
bool |
Show tabular data view |
Legend_Position |
int |
Legend placement |
Focus_Mode |
bool |
Highlight hovered curve |
Measurement_Mode |
bool |
Enable measurement cursors |
Note: This widget exposes 66 configurable properties. The table above covers only a selection — dozens more are available for fine-tuned control over colors, fonts, margins, axis formatting, and behavior.
Usage Example in WinCC OA
CTRL Initialization Script
main()
{
  // Configure trend display
  EWO.AutoScroll_Enabled = true;
  EWO.AutoScroll_WindowSeconds = 3600; // 1 hour window
  EWO.Statistics_Visible = true;
  EWO.UI_CrosshairEnabled = true;

  // Add curves
  EWO.setGraphData(curvesJson);

  // Set time range
  time tEnd = getCurrentTime();
  time tStart = tEnd - 3600;
  EWO.setGraphTimeRange(tStart, tEnd);
}

// Handle range change (user zoom/pan)
void rangeChanged(long startMs, long endMs)
{
  // Request historical data for new range
  EWO.requestHistoricalData(startMs, endMs);
}
Available Signals
| Signal | Parameters | Description |
|---|---|---|
pointHovered |
trendName, timestamp, value |
Crosshair over a data point |
rangeChanged |
startMs, endMs |
Visible time range changed |
trendClicked |
trendName, timestamp, value |
Click on a curve |
legendClicked |
trendName, visible |
Legend item toggled |
legendHovered |
trendName |
Mouse over legend item |
requestHistoricalData |
startMs, endMs |
Request data for new range |
statisticsVisibilityChanged |
visible |
Stats panel toggled |
tableViewVisibilityChanged |
visible |
Table view toggled |