Tables Editor — Visual SQL Pipeline Builder
No-Code Database Queries
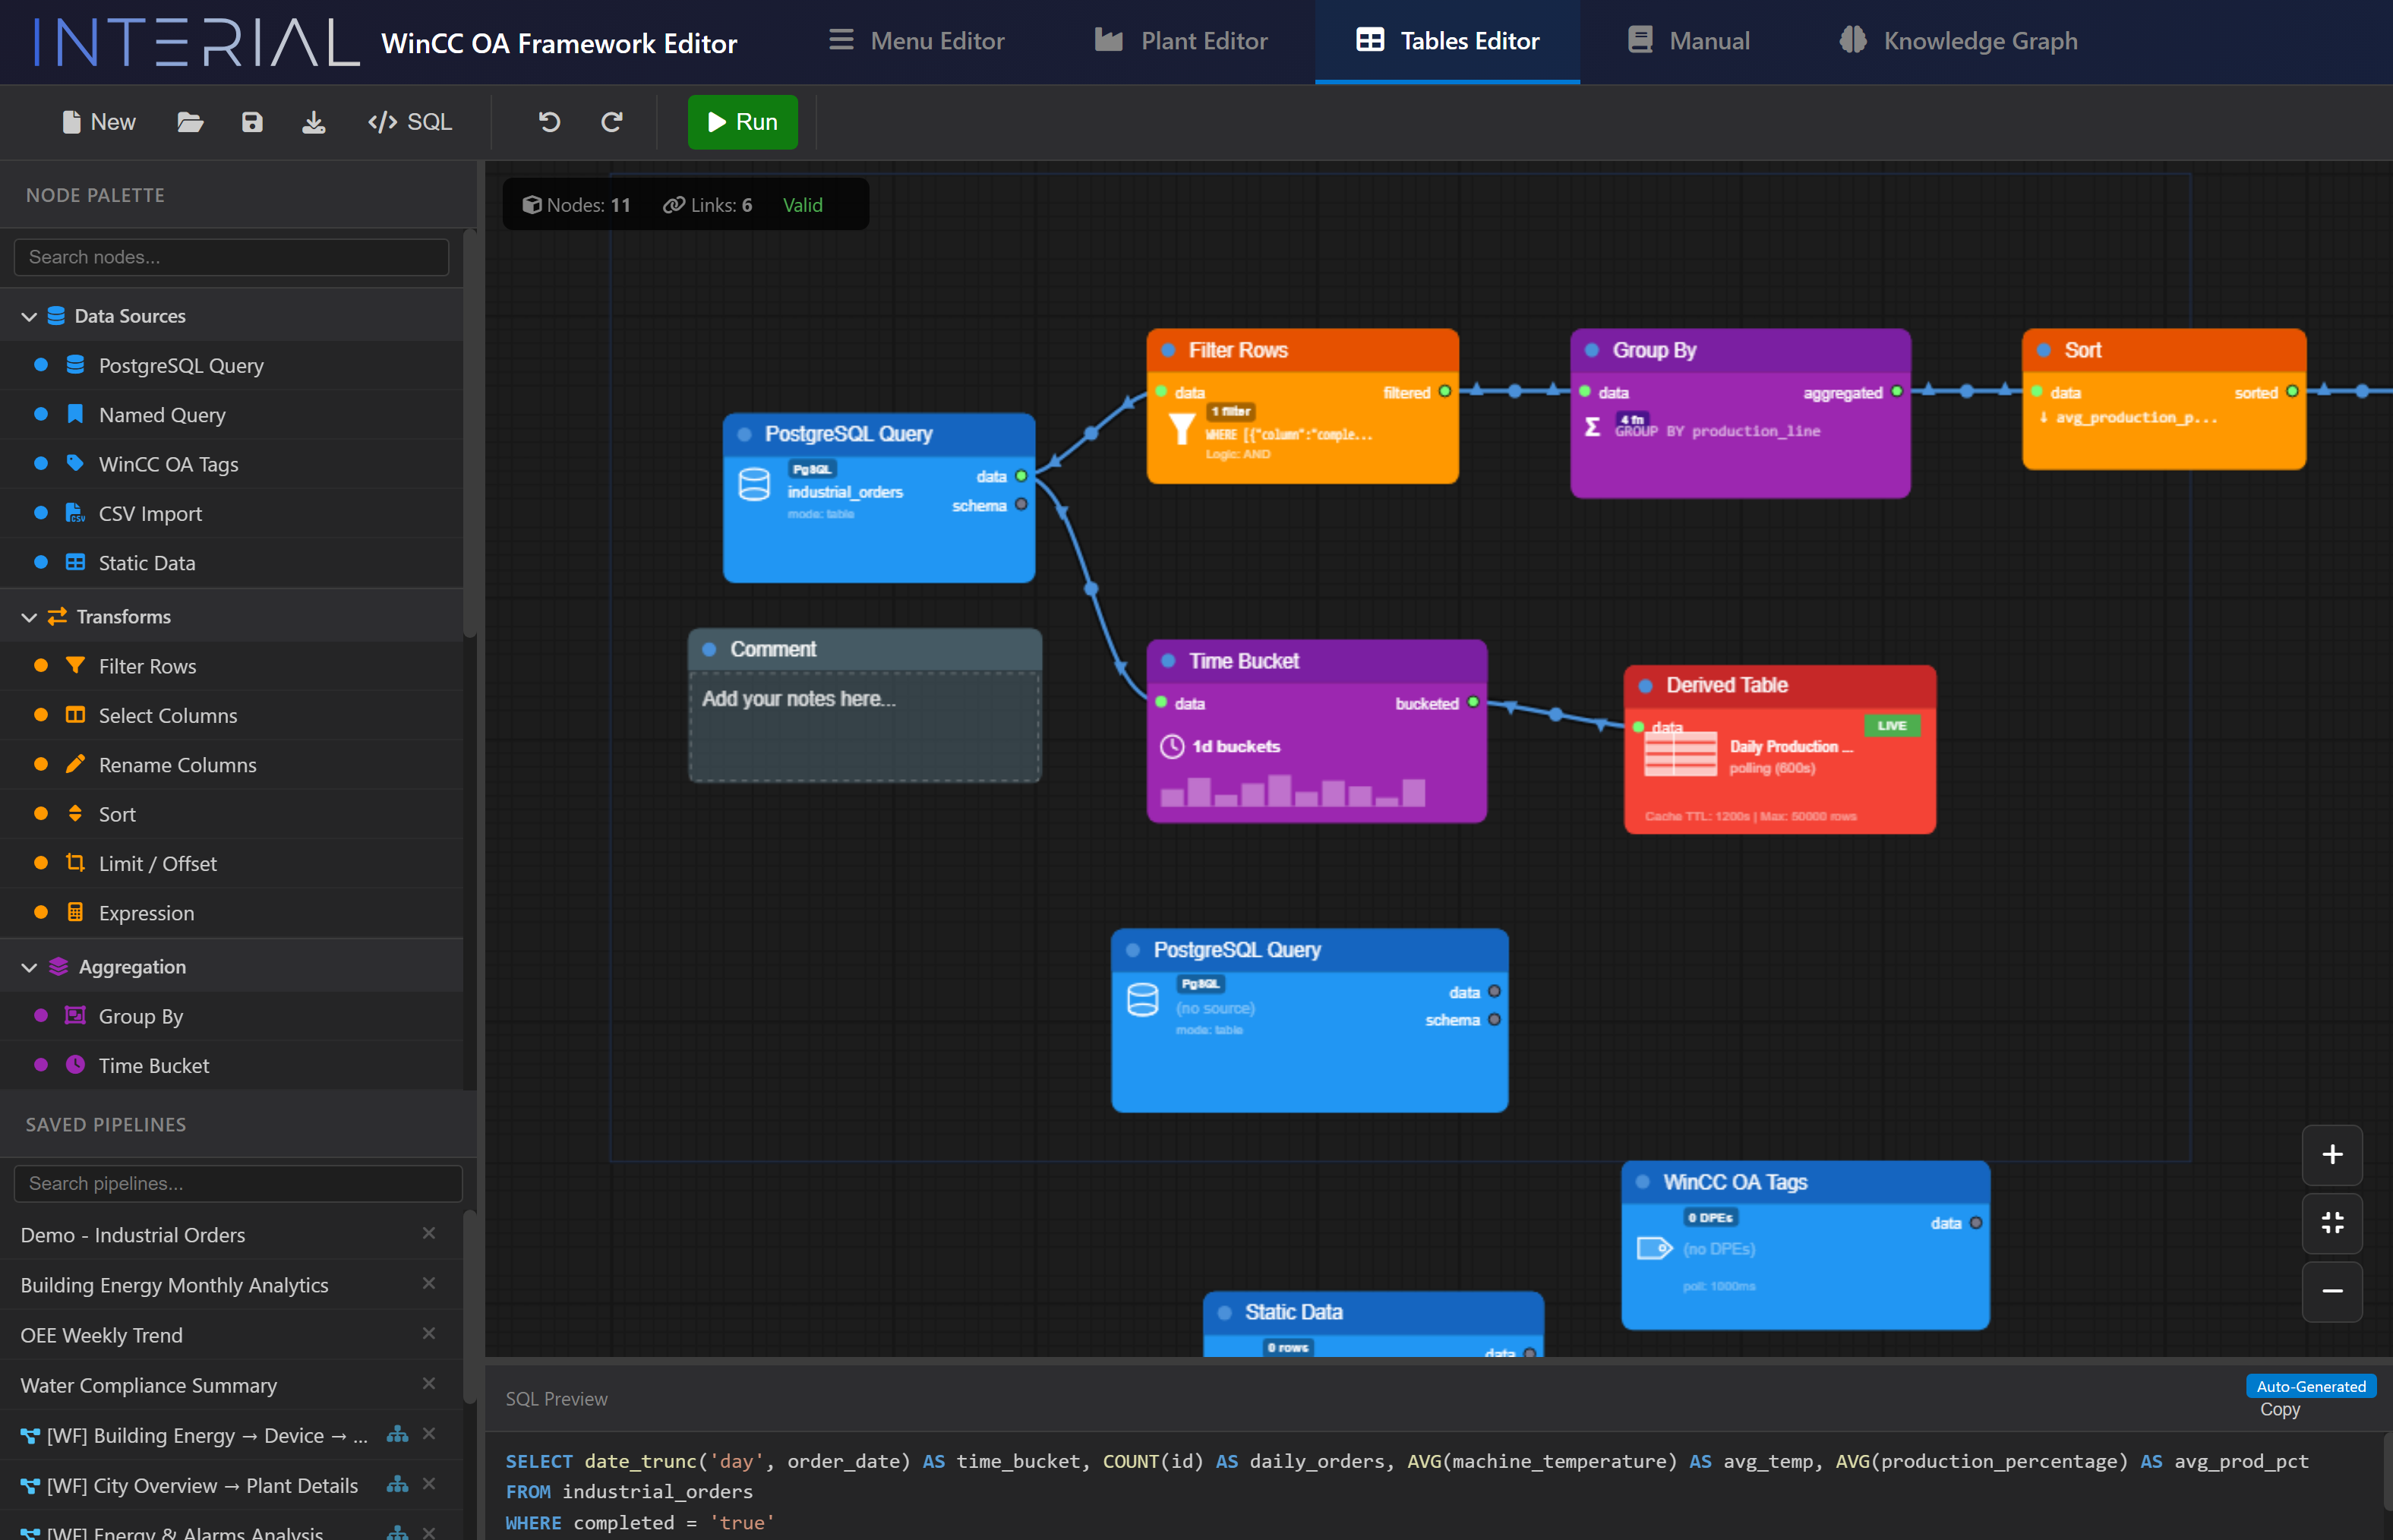
We built a visual SQL query editor that transforms complex database operations into an intuitive node graph. Instead of writing SQL by hand, operators and configurators connect colored nodes — and the system generates optimized queries automatically.
How It Works
Node Types
| Category | Nodes | Purpose |
|---|---|---|
| Data Sources | PostgreSQL Query, Named Query, WinCC OA Tags, CSV Import, Static Data | Bring data into the pipeline |
| Transforms | Filter Rows, Select Columns, Rename Columns, Sort, Limit/Offset, Expression | Reshape and filter |
| Aggregation | Group By, Time Bucket | Aggregate with SUM, AVG, COUNT, MIN, MAX |
| Joins | All SQL join types | Combine multiple data sources |
| Output | Sort, Derived Table | Final result presentation |
Column Propagation
This is one of the smartest features we implemented: automatic schema inference through the pipeline. When you connect a PostgreSQL Query node to a Filter node, the Filter automatically knows which columns are available. Add a Group By after that, and it knows the result schema. This means:
- No manual column mapping
- Errors detected at design time, not runtime
- Downstream nodes always show valid options
SQL-to-Nodes Parser
We also built the reverse direction — paste an existing SQL query and the system decomposes it into a visual node graph. This enables importing legacy queries into the visual editor for modification and maintenance.
Live Preview & Generated SQL
At the bottom of the editor, the system shows the generated SQL query in real time. Click "Run" and results display immediately. This gives full transparency — you can see exactly what the visual pipeline produces and verify it.
Pipeline Storage & Workflow Orchestration
Pipelines can be saved, loaded, and composed into multi-step workflows with dependency resolution:
- Topological sort (Kahn's algorithm) for execution ordering
- Circular dependency detection with clear error messages
- Parameter passing between steps — results from step N feed into step N+1
- Transactional execution — each step runs in its own transaction
From Editor to Live Dashboard — No Code
The real power of the Tables Editor is what comes after designing the pipeline. Every saved pipeline becomes available as a data source for the live application — without writing a single line of code.
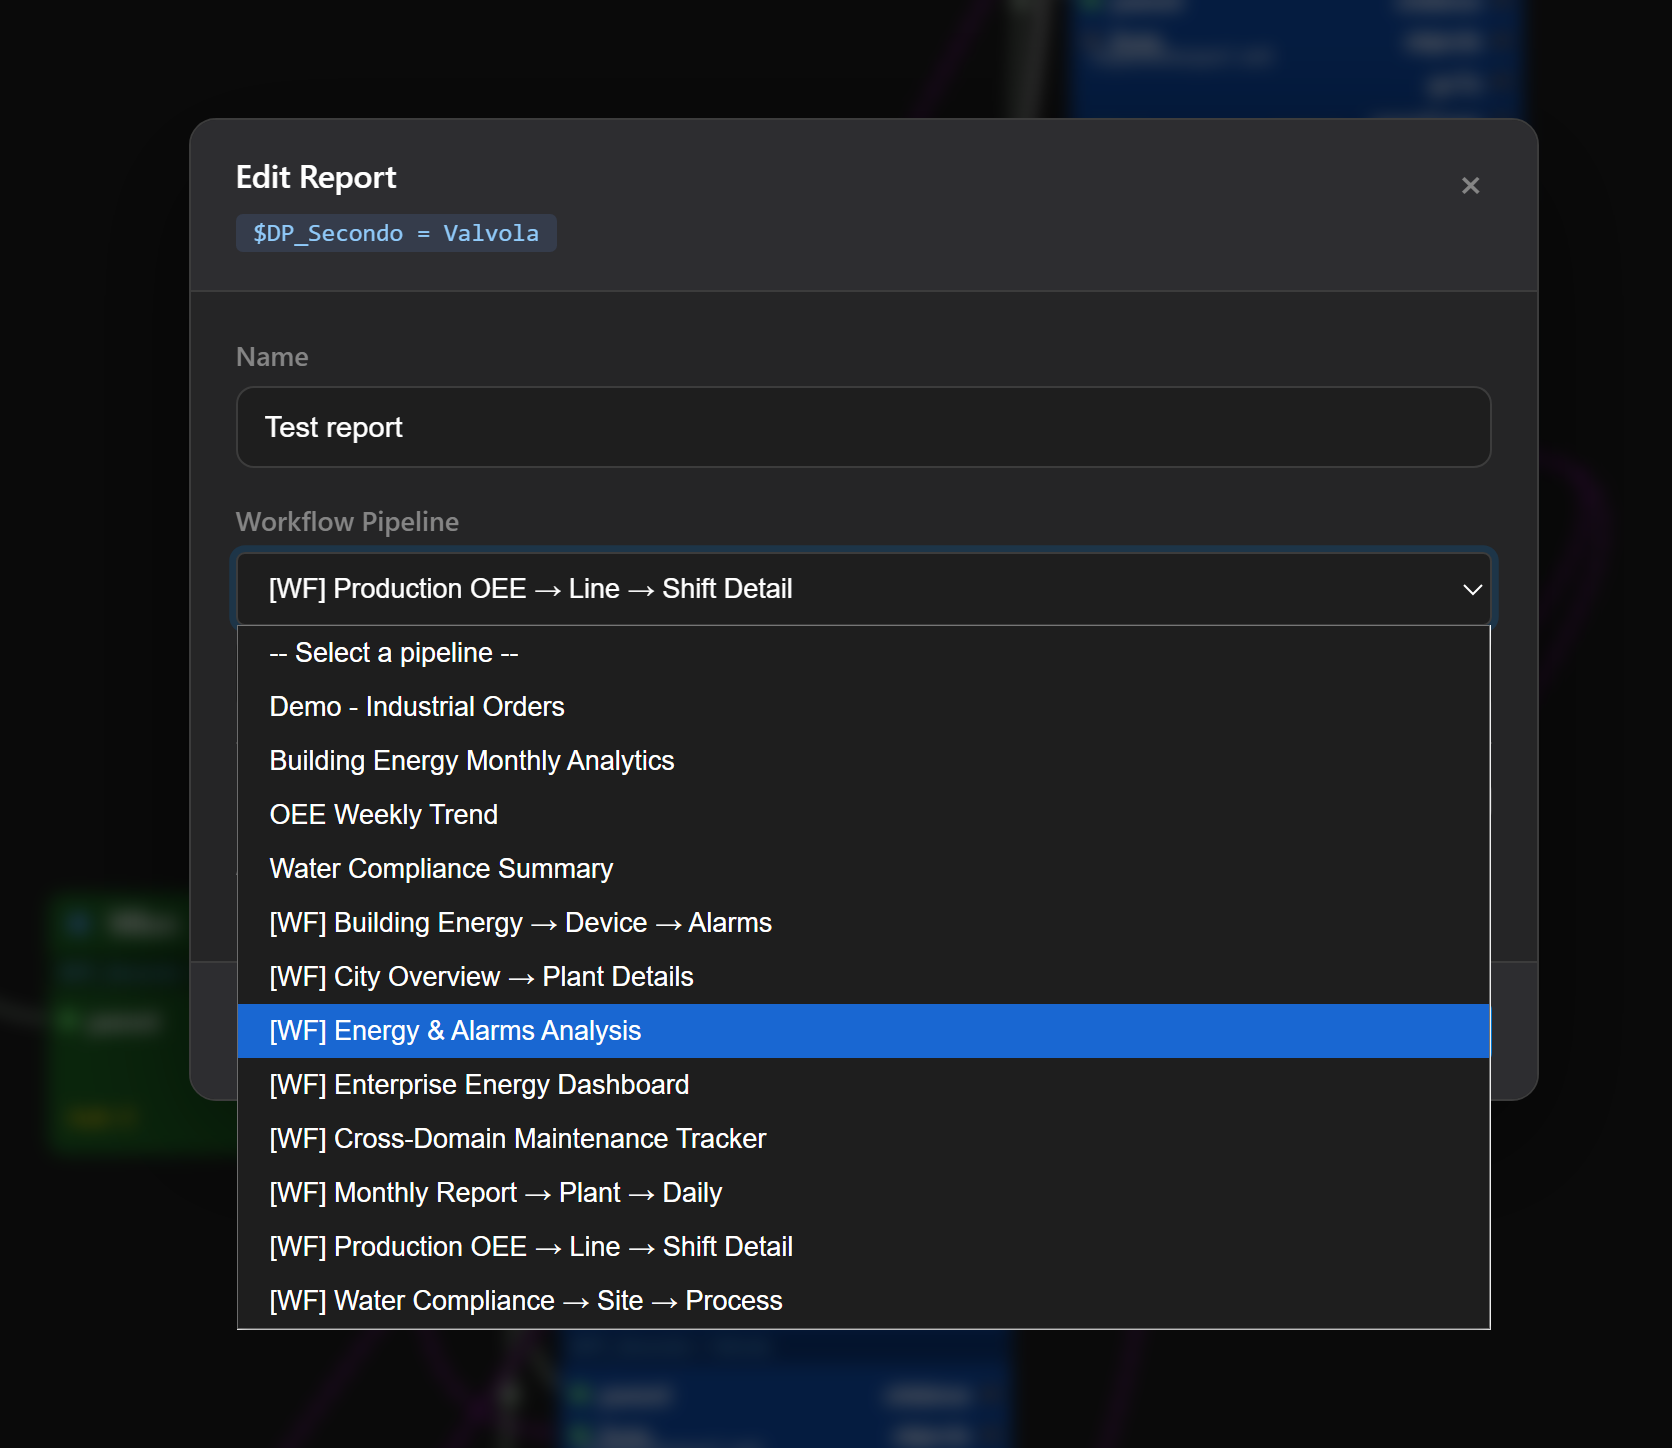
Report Node Integration
In the Menu Editor, a Report node can reference any pipeline by name. The Edit Report dialog shows all available pipelines — both simple queries and multi-step workflows (prefixed with [WF]):
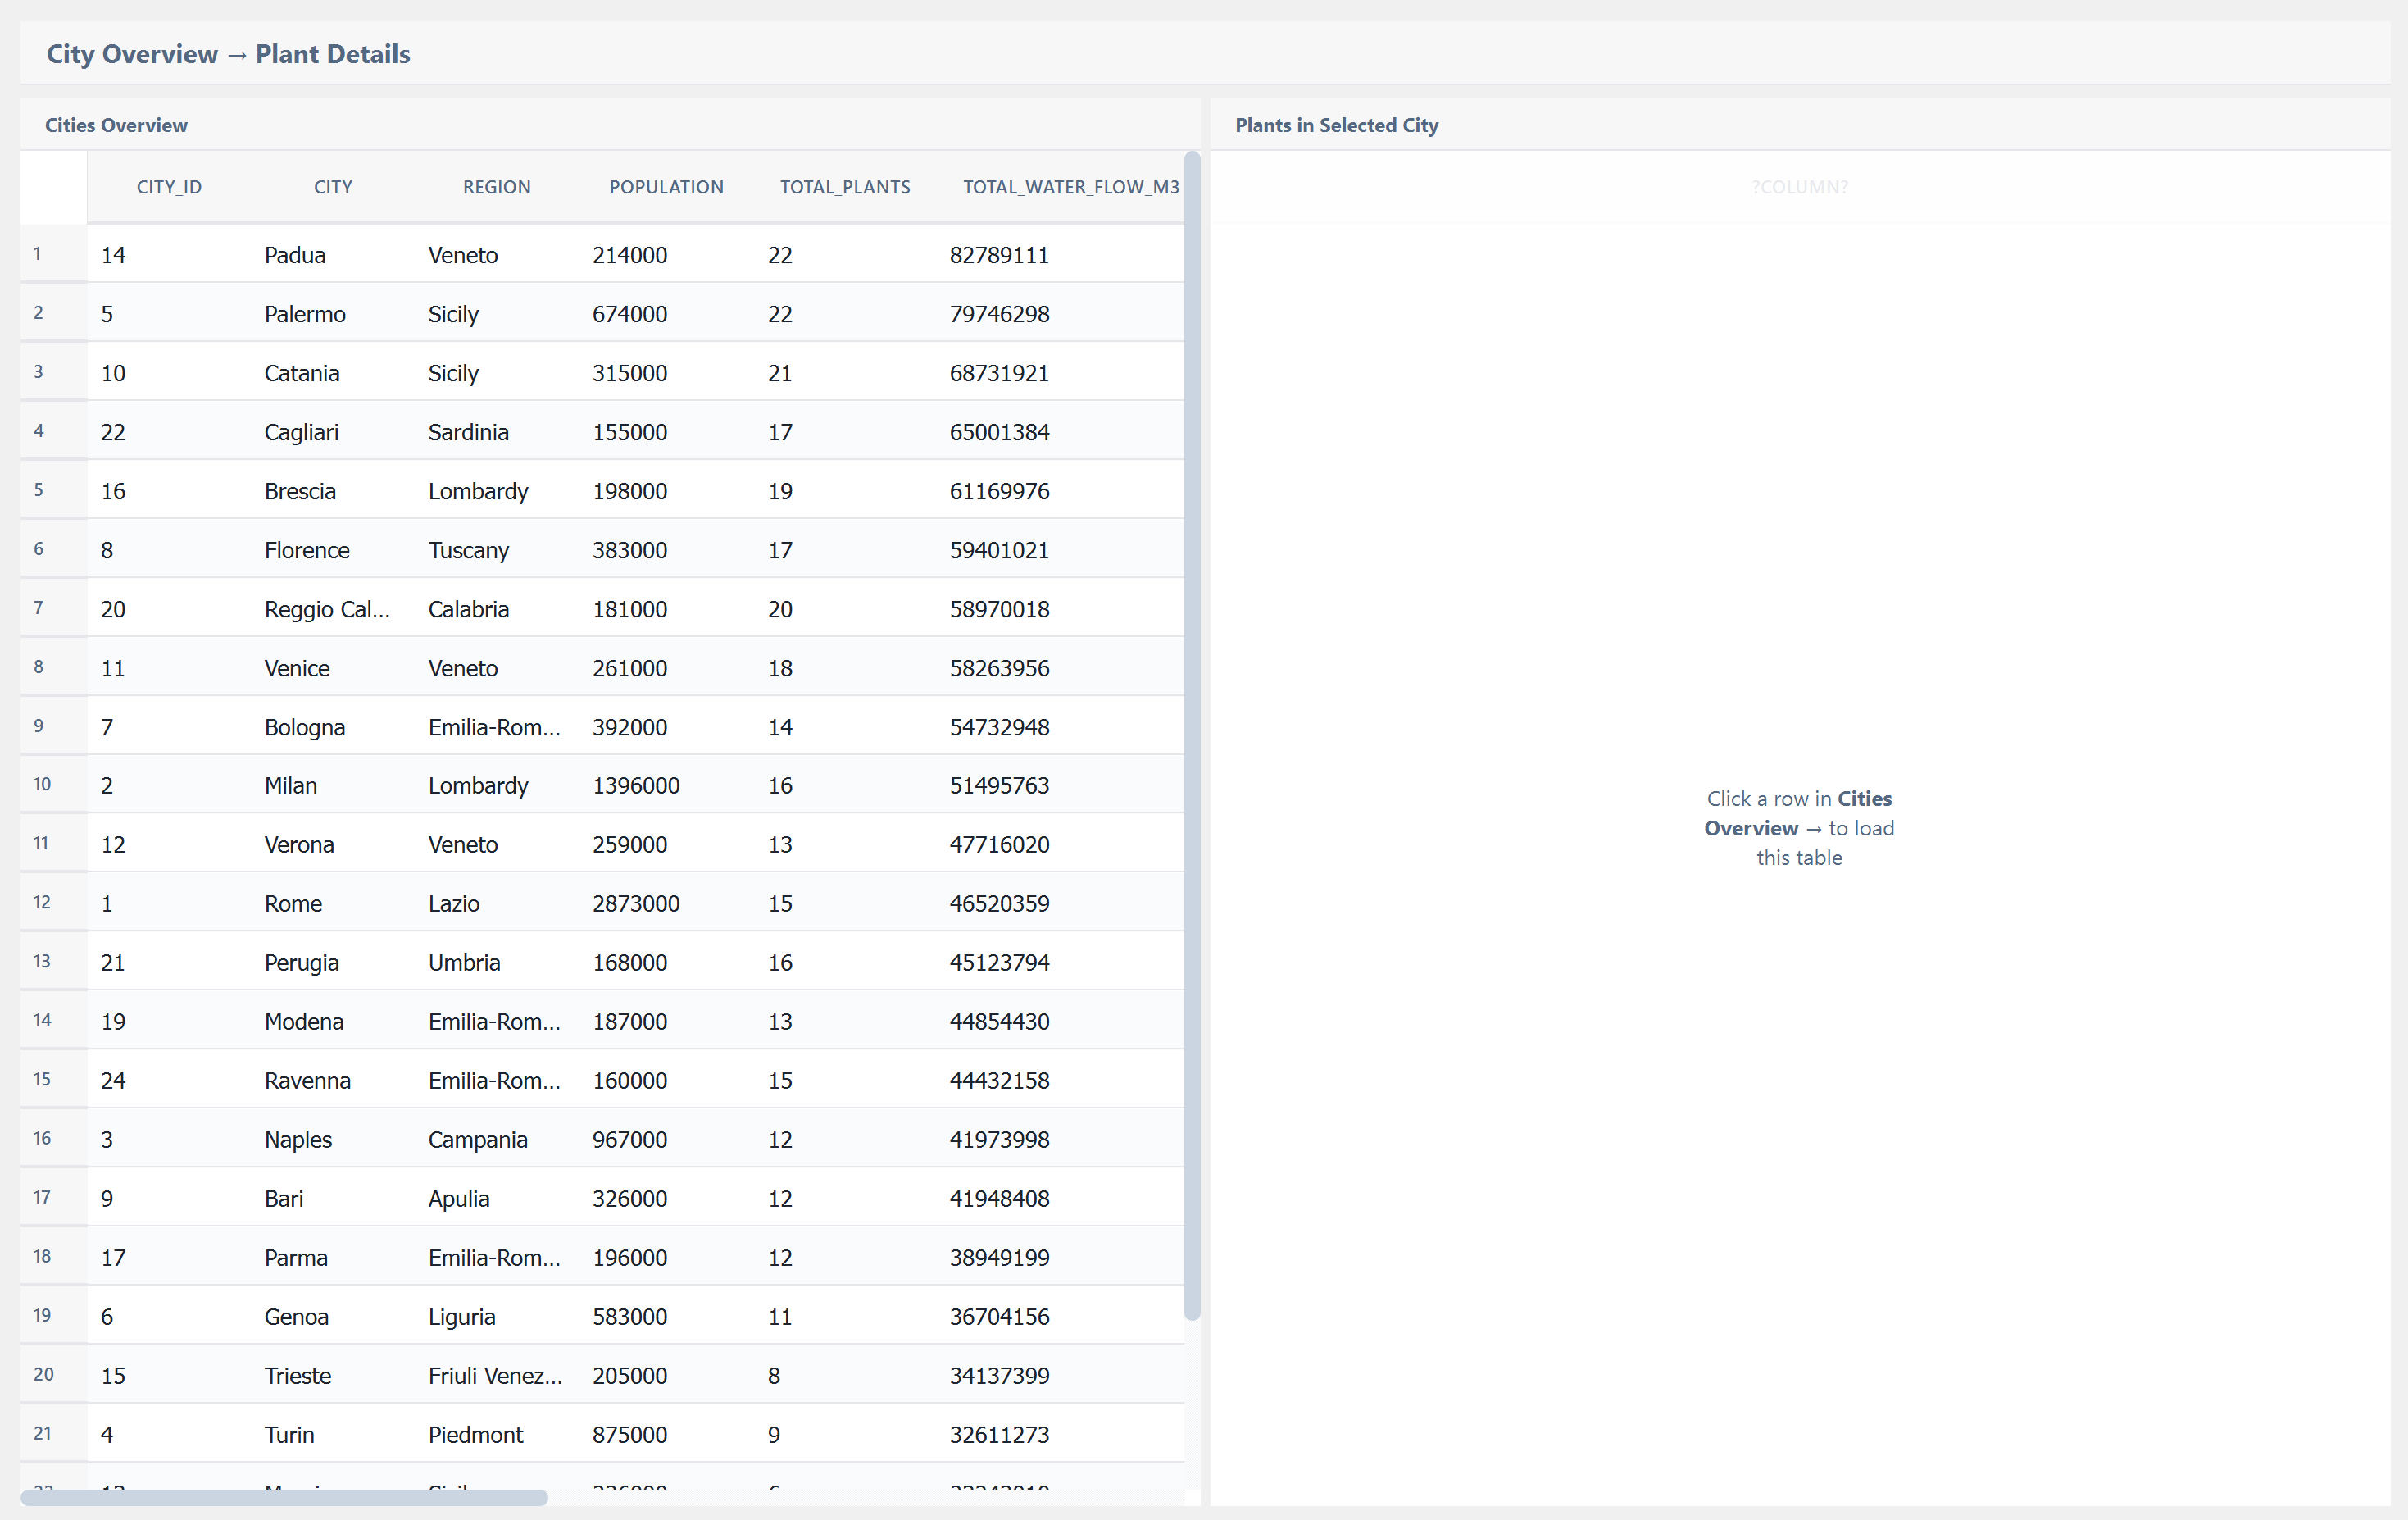
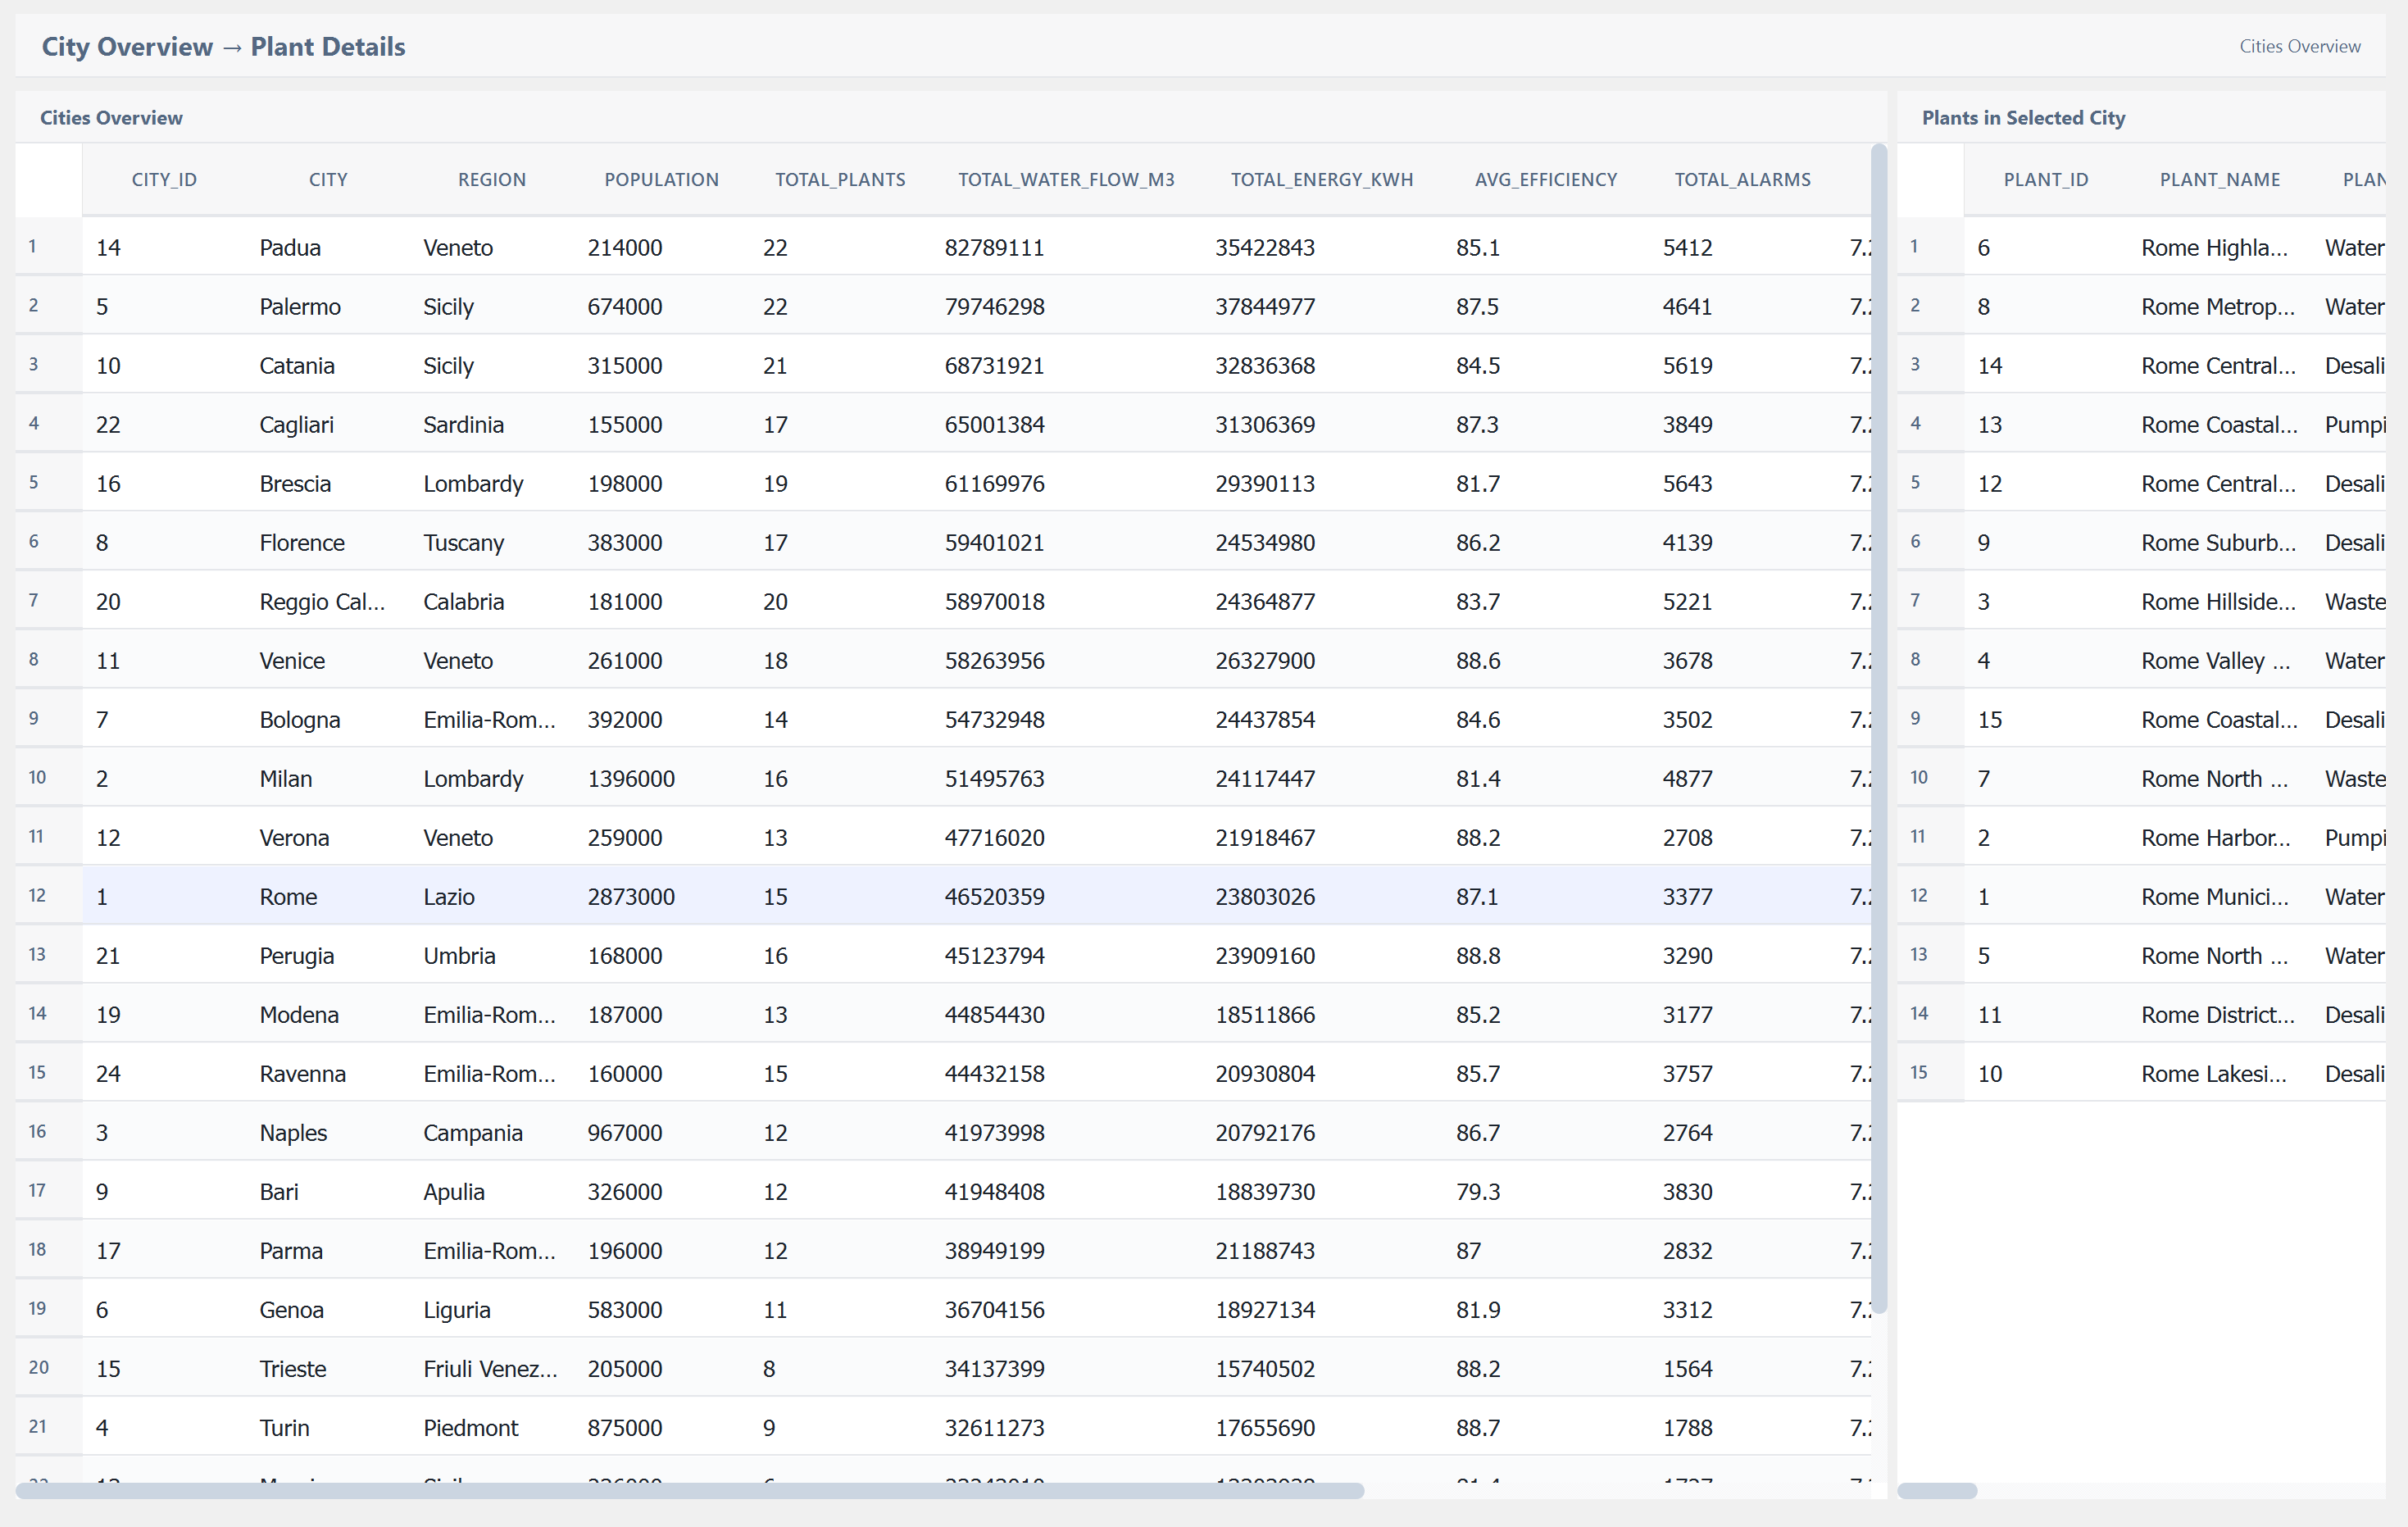
The Result: Production-Ready Tables
Once a pipeline is connected via a Report node, the TablePostgre widget renders the data automatically. Here are examples of tables created entirely through the visual pipeline — zero SQL written by hand, zero backend code:
Complete No-Code Path
The workflow from design to dashboard is entirely visual:
- Build the query visually in the Tables Editor (drag nodes, connect wires)
- Save it as a named pipeline
- Reference the pipeline from a Report node in the Menu Editor
- The TablePostgre widget executes it and displays the results
No SQL written. No backend code. Just visual connections.