Menu Editor — Visual Application Builder
The Heart of InteriaLib
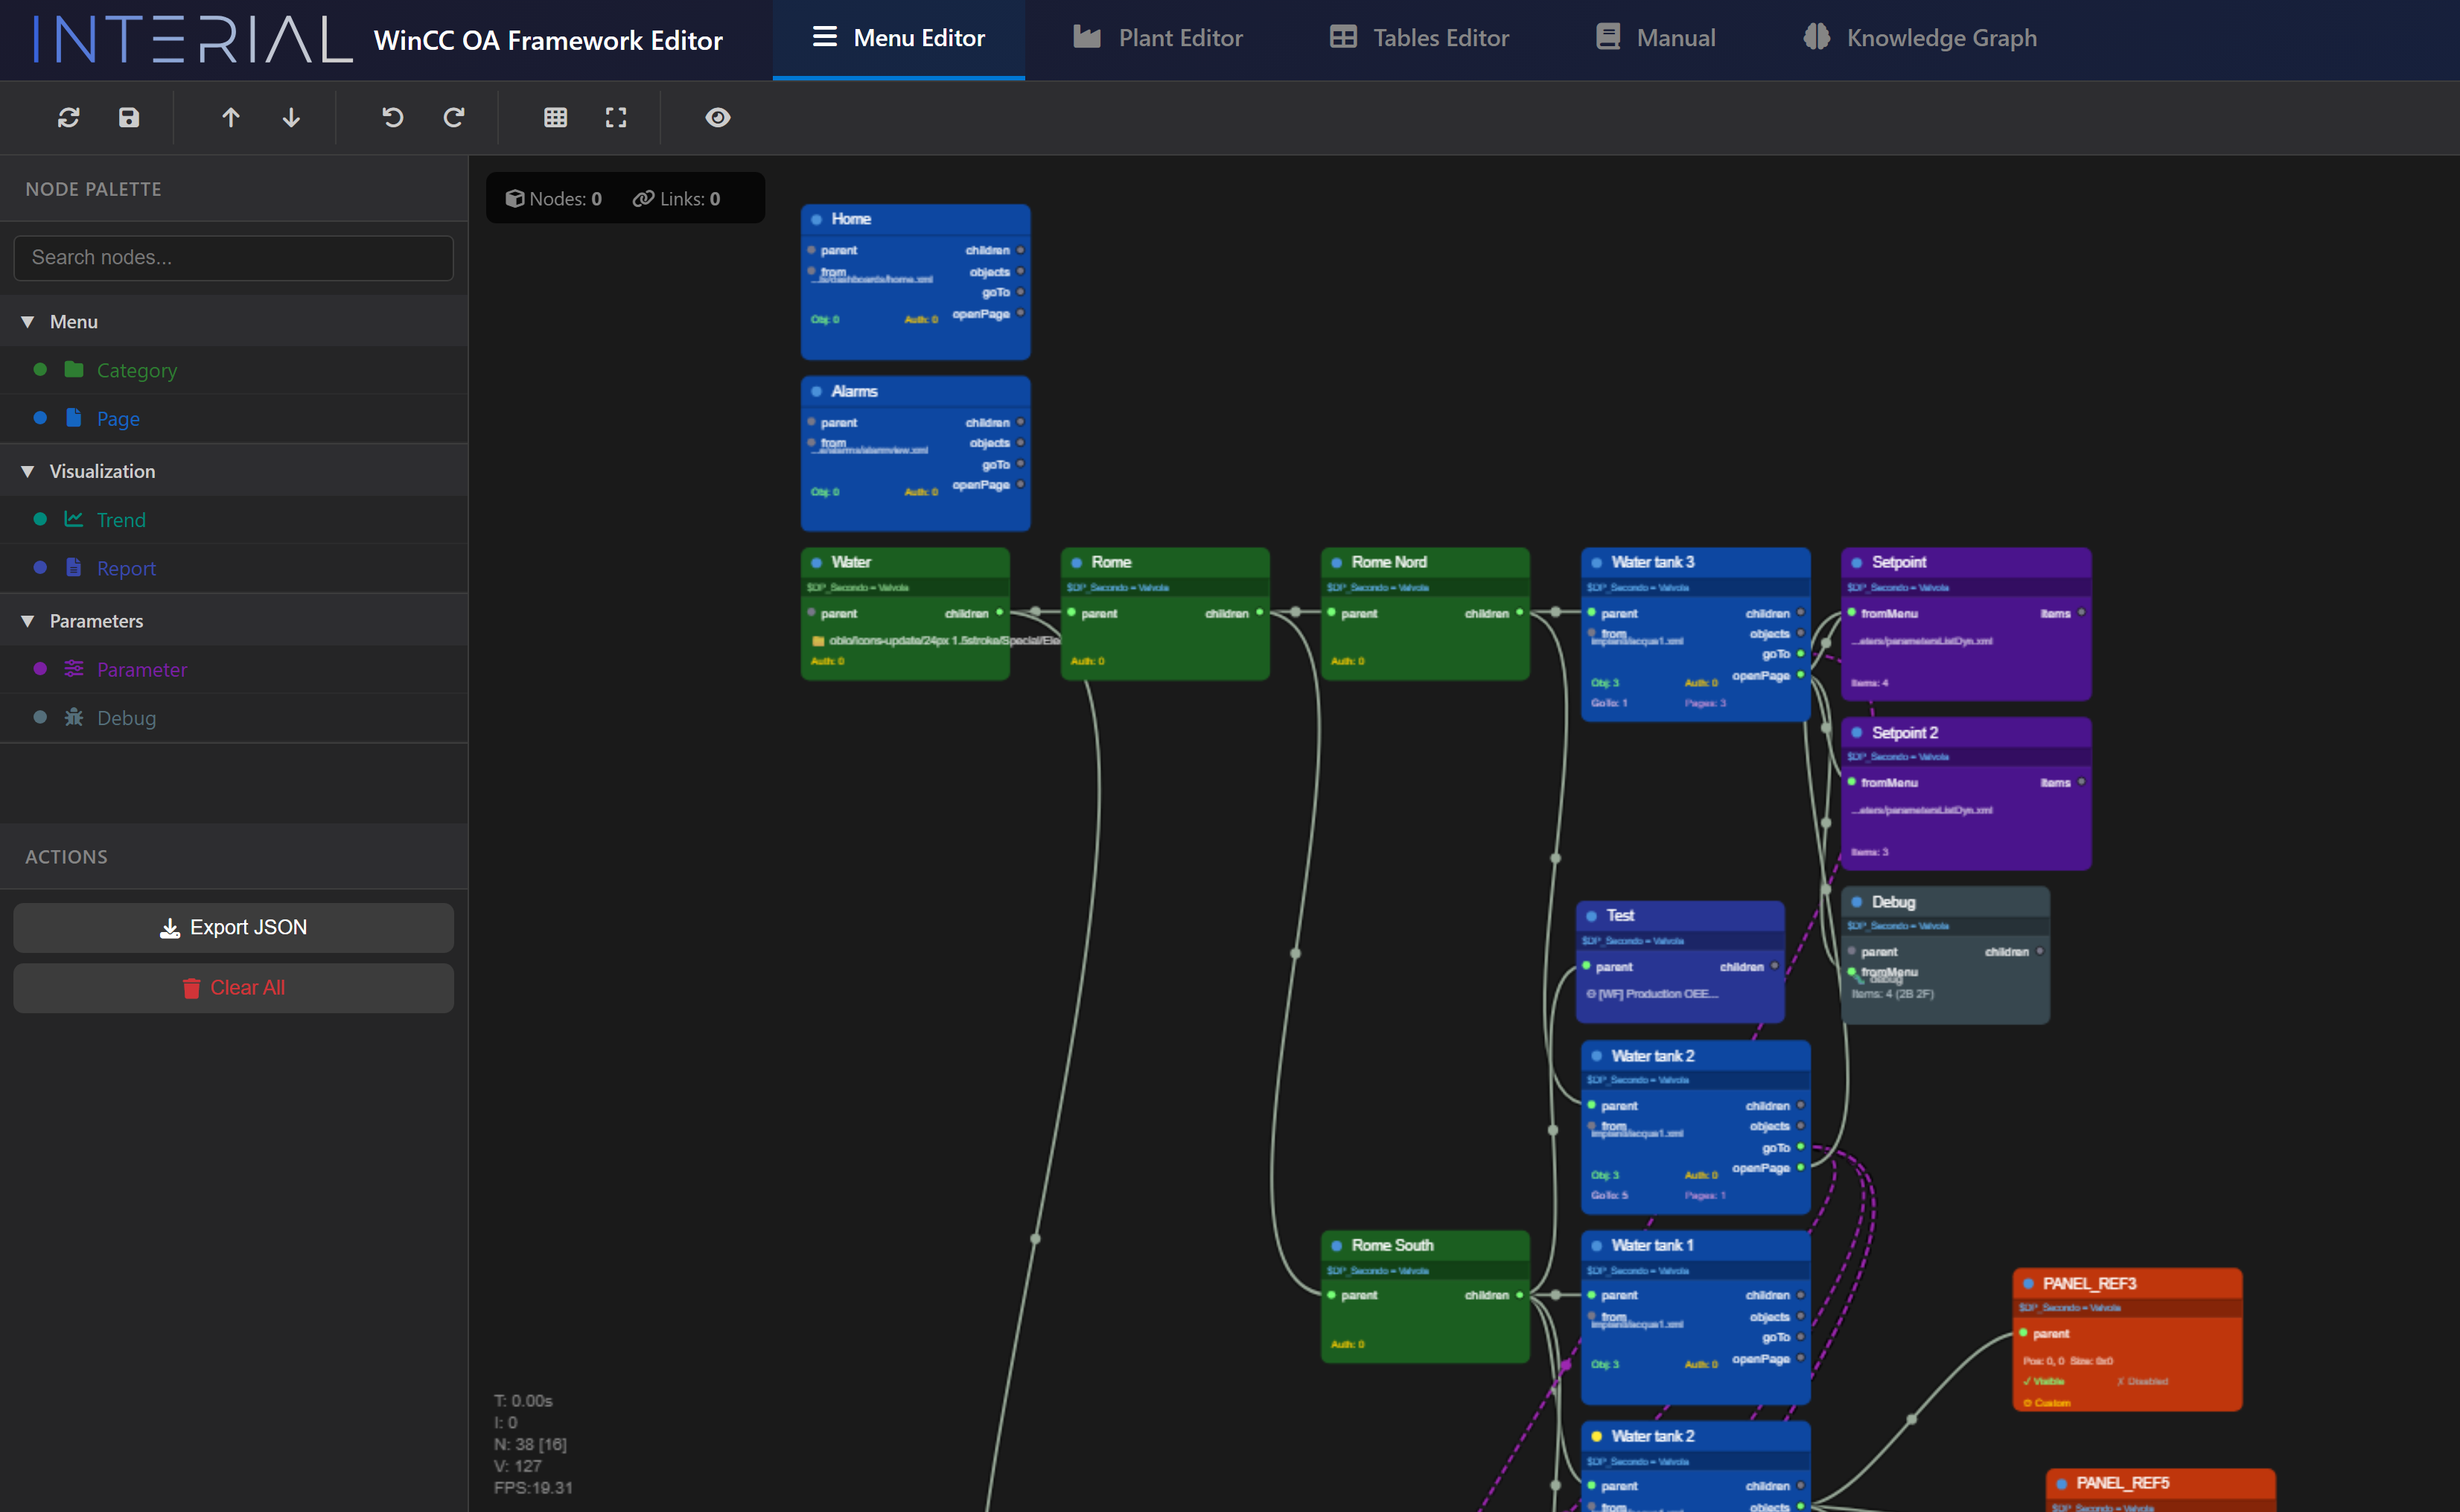
The Menu Editor is the centerpiece of the entire platform. We built it to replace the traditional, error-prone process of manually editing JSON menu structures with a visual, real-time, node-based canvas where the entire application structure is designed, connected, validated, and deployed — without writing a single line of code.
This Is Not a Simple Tree Editor
It is a full visual programming environment with 8 specialized node types, 6 connection types, $DP variable inheritance, debug condition monitoring, GoTo navigation shortcuts, badge propagation, and instant one-click deployment to the live WinCC OA runtime.
8 Node Types — Purpose-Built Building Blocks
Every element of the application is represented by a color-coded, purpose-built node:
| Node | Color | Purpose |
|---|---|---|
| Category | Green | Folder/section in menu tree |
| Menu Item | Blue | Page with panel — the core building block |
| Page Object | Orange | Visual element on a page (IoField, Button, etc.) |
| Parameters Page | Purple | Configuration form attached to a page |
| Parameter Item | Pink | Single configurable field with datapoint binding |
| Debug / Setpoint | Gray / Red | Condition monitoring with real-time evaluation |
| Trend | Teal | Trend visualization page |
| Report | Indigo | Report with SQL pipeline reference |
Live Example — Building an Application
Step 1: Create the Structure
Drag a Menu Item node onto the canvas. Name it "Rome Nord", browse and select the panel file, choose an icon from the integrated gallery, set auth level. Connect it to the parent "Water" Category by dragging a wire. The auto-layout algorithm instantly repositions all nodes.
Step 2: Add $DP Variables
On the "Water" category, define $DP_System = "Water". These variables automatically propagate to every child node via a custom inheritance algorithm (BFS walk up the graph). On the canvas:
- Green badges = variables defined on this node (own)
- Blue badges = variables inherited from parents
A single generic panel template can serve hundreds of plants — the $DP variables resolve the specific datapoints at runtime. Changing a variable at the top cascades to every descendant automatically.
Step 3: Add a GoTo Shortcut
Drag the goTo output of "Rome Nord" to another Menu Item node. A dashed purple line appears — visually distinct from parent-child wires. In the live application, a shortcut button instantly appears in the DropMenu. Navigation automatically resolves the full menu path, auth level, and all $DP parameters.
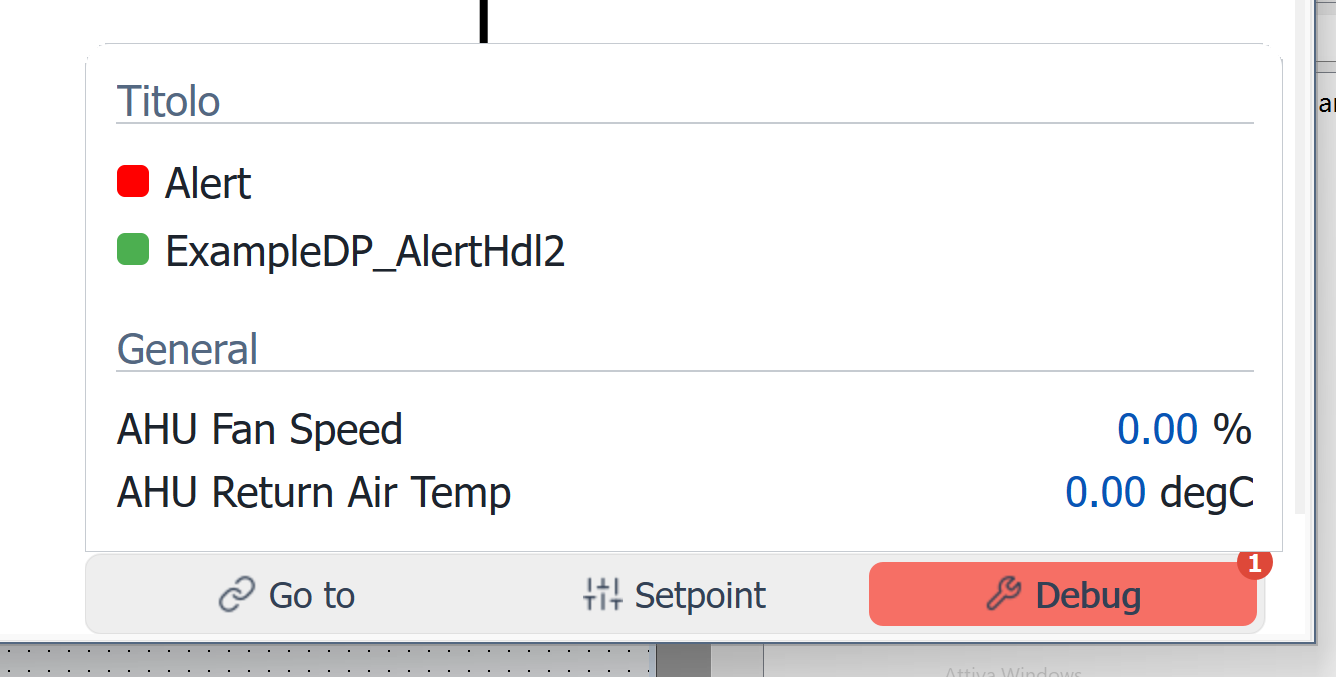
Step 4: Add Debug Monitoring
Drag a Debug node and connect it. Define monitoring items with datapoint paths and expected values. Set a condition expression like a && b > 50 && c with a failure color.
What happens in the live application — instantly:
- The centralized Condition Manager detects the change
- It connects to each datapoint — creating real-time monitoring
- When any value changes, the condition is evaluated
- If the condition fails (e.g., a pump stops): the menu item turns red
- A badge counter appears showing the number of failures
- The badge propagates upward through every ancestor
- The DropMenu debug tab starts blinking to grab attention
Step 5: Save — One Click, Instant Deployment
Press Ctrl+S. The editor exports the graph into two JSON structures and saves them to WinCC OA via the REST API. The live application updates instantly — no restart, no compile, no deployment pipeline.
  ✅ Menu item appears in the sidebar
  ✅ Debug monitoring activates
  ✅ Badges start propagating
  ✅ GoTo shortcuts become available
  ✅ Colors reflect live plant state

  ALL IN REAL TIME. NO RESTART.
The Centralized Condition Manager
We built a dedicated background process that acts as the centralized intelligence for all debug monitoring. No panel, no widget, and no UI script manages its own datapoint connections. Everything is centralized in one place.
| Traditional Approach | Our Approach |
|---|---|
Each panel calls dpConnect() for its own data → N×M connections |
Condition Manager connects once per datapoint → M connections total |
| Badge logic duplicated in every panel | Badge logic centralized, tested once |
| Adding debug conditions = editing code | Adding debug conditions = dragging a node |
| No parent visibility into child states | Automatic bottom-up propagation |
| Static menu colors | Dynamic colors based on live conditions |
Advanced Features
- Real-time DPE validation — every datapoint path validated against the live system (green = exists, red = invalid), with auto-fetched description and unit
- Undo/Redo — 50-level history with full graph state snapshots
- Auto-Layout — one-click hierarchical positioning (Sugiyama algorithm)
- Icon Gallery — integrated browser with folder navigation and search
- Copy/Paste with ID regeneration
- Display Order Overlay — shows exact runtime menu ordering
- LOD rendering — details hidden at low zoom for smooth performance even with 1000+ nodes